
On this page, you can find the latest statistics and figures on fatal cycling accidents in the UK.
A fatal cycling accident is any incident on a road where a car or motorcycle is involved in an incident with a bicycle in which the cyclist dies.
There can be various causes of accidents involving cyclists, such as careless driving and driving while under the influence.
The UK government recently changed the Highway Code to provide cyclists with greater protection and rights. Our research set out to identify whether cyclists were in fact safer on our roads as a result.
Get Help After A Cycling Accident
If you have lost a loved one in a cycling accident and would like advice on claiming compensation, Personal Injury Claims UK can help.
We work with some of the finest cycling accident solicitors in the country. They can help you not just to recover compensation, but to secure justice for the person you have lost.
To speak with us today, call us for free on the number at the top of this page.
How We Conducted Our Research Into Fatal Cycling Accidents
We conducted our research into fatal cycling accidents by submitting Freedom of Information requests to police forces across the country.
We have analysed the data provided in return and produced the findings below, which you can find in each area of the country.
Statistics On Fatal Cycling Accidents In The UK: By Area
Hertfordshire

Cyclist fatalities skyrocketed in Hertfordshire since 2020
Hertfordshire has been revealed as the deadliest area for cyclists in South East England with the highest number of fatalities recorded in the last three years.
The district accounted for 27% of cyclists who were killed by cars in the South East, according to Hertfordshire Police.
Our research found the number of cyclist deaths recorded in the county has soared by 138% since 2020.
In the UK, the number of biker fatalities has been steadily declining in the past three years, with 141 reported in 2020, compared to 93 last year, 2023, but Hertfordshire figures defy the trend.
A total of 27 cyclists were killed following crashes with cars in the county. Figures soared from 8 fatalities between 2020/21 to 19 in 2022/23.
A further 396 sustained serious injuries from collisions, meaning injuries were so severe they had a significant, long-term impact on the rider’s life.
Between 2020 and 2023, cyclists who suffered slight injuries in Hertfordshire climbed by a staggering 27%.
The county reported more fatalities than London’s Met Police, which ranked second for the number of cyclist fatalities in the past three years.
Greater London
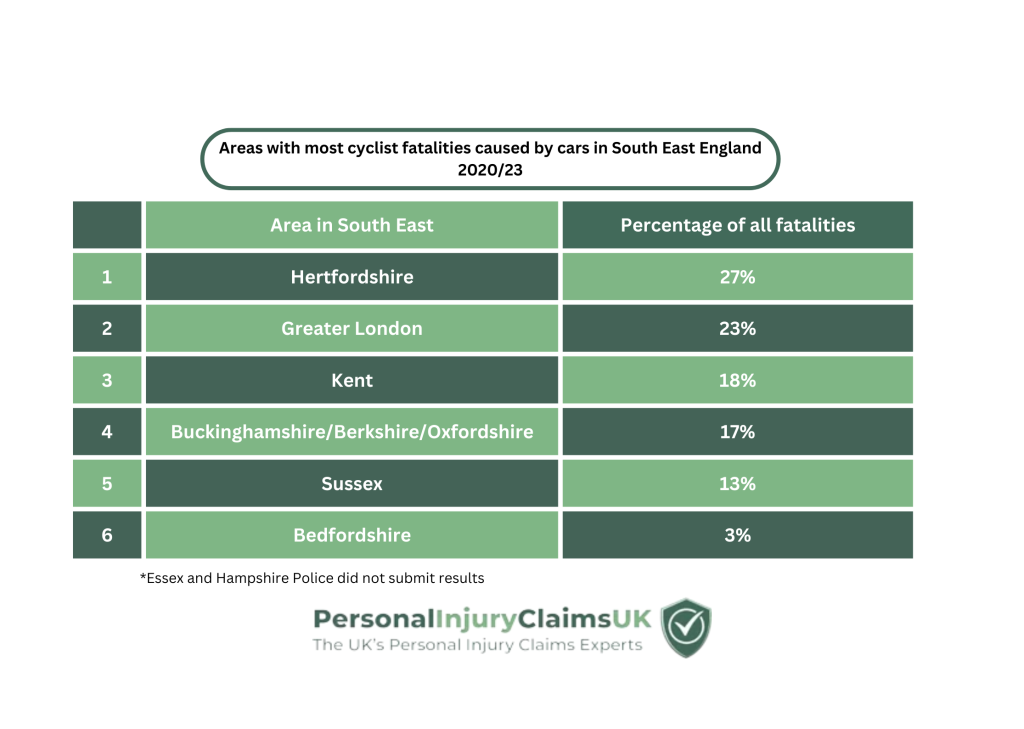
Cyclist car collisions in South East England Statistics
The number of cyclist fatalities on London roads has plummeted by 65% in the last three years.
Although figures still account for a hefty 23% of the national average, there has been a sharp decline in both the number of deaths and injuries sustained since 2020.
Cyclist deaths fell from a total of 17 between 2020/21 to 6 in 2022/23. This is despite pandemic lockdowns coming to an end which limited the amount of journeys being taken in the city.
The Metropolitan Police also confirmed a rapid decline in both the number of serious injuries and slight injuries sustained by cyclists in Greater London. Figures fell from 9,944 injuries to 5,523 between 2022/23.
Overall, the city still ranks second in South East England for the number of cyclist fatalities. But surprisingly fell behind the more sparsely-populated county of Hertfordshire, which accounted for 27% of deaths in the district.
Leicestershire

Leicestershire Cyclist Car Collisions Statistics
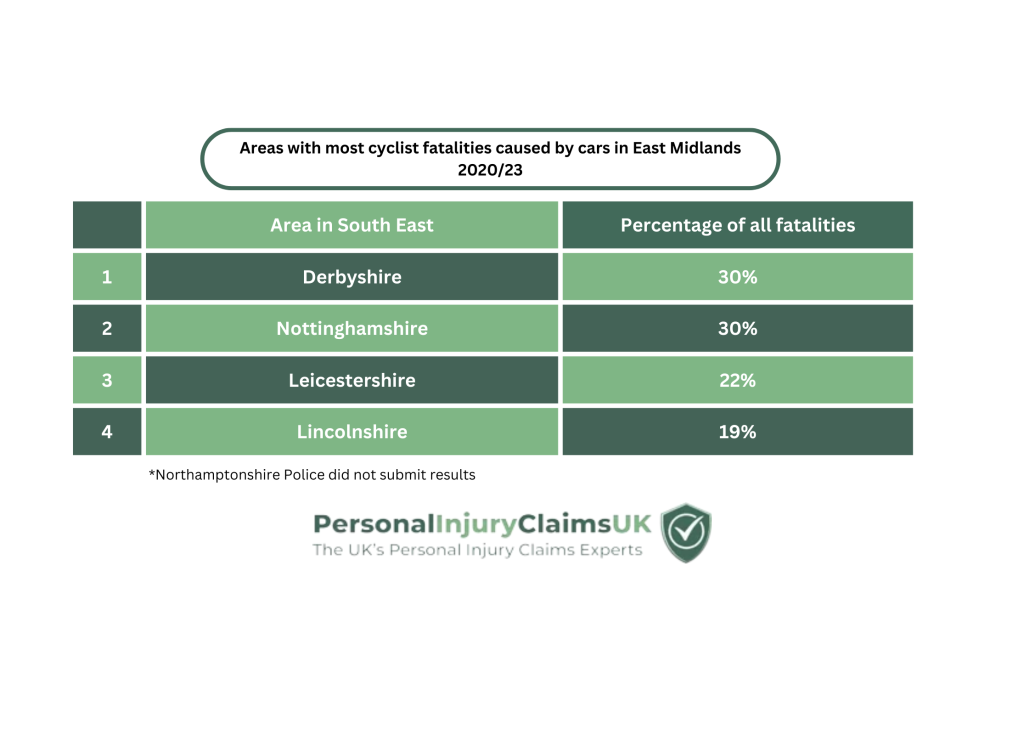
Leicestershire has the biggest increase in cyclist fatalities in the East Midlands as figures double in the last three years.
The area accounted for 22% of cyclists who were killed by cars in the East Midlands since 2020, according to Leicestershire Police.
The force was just one of five to report rising fatality figures in the UK.
Across the nation, the number of biker fatalities has been steadily declining in the past three years, with 141 reported in 2020, compared to 93 last year, 2023, but Leicestershire figures defy the trend.
Along with the number of cyclists killed following crashes with cars, figures also increased for the number of serious and slight injuries sustained.
Between 2020/21 and 2022/23, cyclists who sustained serious injuries following a crash soared by 87%. Those who suffered slight injuries rose by 81%.
Furthermore, the number of collisions overall in Leicestershire increased by 83% in the same time period.
Overall, Leicestershire holds the second highest number of fatalities in the East Midlands, recording 6 deaths in total. It follows behind Derbyshire and Nottinghamshire, which both reported 8 deaths in the past three years.
The East Midlands accounts for 27% of the national average of cyclist deaths.
Lincolnshire, though last on the list, still recorded five cyclist fatalities since 2020.
 Cyclist road collisions in East Midlands
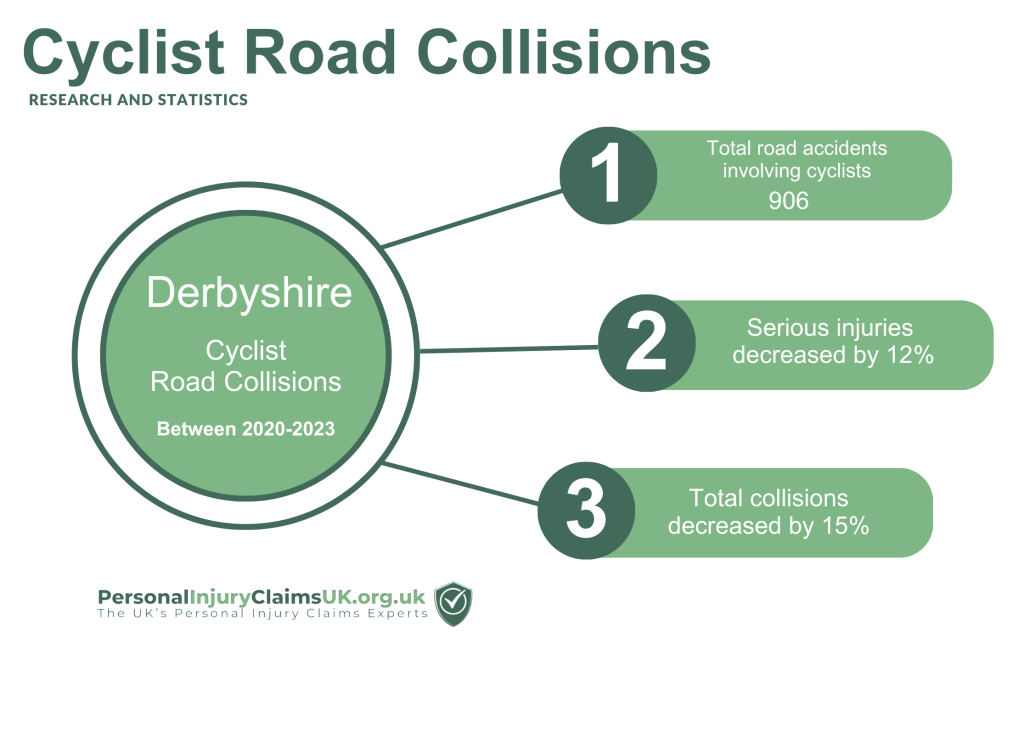
Derbyshire

Cyclist Road Collisions Derbyshire Statistics
Derbyshire is the most dangerous area for cyclists in the East Midlands based on the number killed by cars in the last three years.
But though figures are high, there have been significant improvements across the county in the last three years.
Derbyshire accounted for 30% of all cyclist fatalities in the East Midlands. It matched Nottinghamshire in the number of deaths since 2020.
The county surpassed all others in the district when it came to the amount of serious and slight injuries sustained by cyclists after colliding with cars.
Despite this, Derbyshire showed the biggest decrease in numbers across the board in the last three years. Figures including fatalities, serious and slight injuries and the number of collisions decreased drastically since 2020.
Fatalities decreased 67% from between 2020/21 to 2022/23 and those sustaining serious injuries fell by 12%. Cyclists who suffered slight injuries went down by 15%, as well as the number of cyclist collisions with cars.
Nottinghamshire

Cyclist Road Collisions statistics in Nottinghamshire
Nottinghamshire surpassed all others in the district when it came to the amount of serious injuries sustained by cyclists after colliding with cars.
Despite this, the county showed significant decreases in numbers across the board in the last three years. Figures including fatalities, serious and slight injuries and the number of collisions all decreased since 2020.
Fatalities decreased by 40% from between 2020/21 to 2022/23 and those sustaining serious injuries fell by 19%. Cyclists who suffered slight injuries went down by 7%, as well as the number of cyclist collisions with cars which dropped by 10%.
Norfolk

Norfolk cyclist fatalities tripled in last three years
Norfolk has seen the biggest increase in cyclist deaths after crashing with cars in the last three years.
The area accounted for the majority (26%) of cyclists who were killed by cars in the East of England since 2020, according to Norfolk Police.
The force reported one of the biggest increases in fatality figures in the UK.
Figures for the East of England for 42% of the national average of cyclist deaths.
The number of cyclists killed tripled by a staggering 167% from between 2020/21 and 2022/23.
Figures for riders who sustained injuries however, did slightly decrease, as did the total number of collisions between cyclists and cars in the same period.
Overall, Norfolk Police reported the highest fatality figures in the East of England followed by Cambridgeshire Police, which accounted for 24% of deaths.

Cyclist road collisions East England statistics
South Yorkshire

South Yorkshire had the biggest increase in cyclist fatalities
South Yorkshire has seen the biggest increase in cyclist deaths after crashing with cars in the last three years.
The area accounted for the majority (24%) of cyclists who were killed by cars in the East of England since 2020, according to South Yorkshire Police.
The number of cyclists killed tripled by a staggering 200% from between 2020/21 and 2022/23, one of the biggest increases in fatality figures in the UK.
Despite the rapid increase, figures did remain lower than other areas in the East of England, accounting for 19% of the district’s figures.
The number of cyclists who sustained serious injuries decreased by 15% and those who suffered slight injuries went down by a sizeable 22%, as did the total number of collisions between riders and cars, which dropped by 19%.
West Midlands

West Midlands had highest cyclist fatalities in the UK
West Midlands has by far the highest cyclist fatality figures in the UK, making up an eye-watering 61% of figures in the last three years.
Since 2020, 426 cyclists have died in road collisions in the UK, according to government statistics. The West Midlands makes up the majority of numbers, totaling 261 deaths between 2020 and 2023.
Figures provided by West Midlands Police far out way those provided by 38 other police forces in the UK.
To put numbers into context, Scotland was second highest in the UK for the most cyclist deaths in the last three years, Police Scotland reported 31 deaths since 2020, accounting for 7% of UK fatalities.
The West Midlands is predominantly made up of Birmingham, Coventry and Wolverhampton.
Last June, there were calls to curb dangerous driving in the West Midlands following two separate hit and run incidents involving cyclists who both died. The tragedies happened within two weeks of each other prompting the need for reform.
The West Midlands walking and cycling commissioner, Adam Tranter, said “we cannot accept this as normal,” the BBC reported in June 2023.
“We have to turn the tide on aggressive driving in Birmingham” said Mr Tranter, who is employed by the West Midlands Combined Authority.
But 10 months later, it seems not much has changed.
Cyclists who sustained serious injuries following a collision with a car increased in the county by 5% and those who suffered slight injuries rose by 7%. Overall collisions between cyclists and cars jumped up by 6% across the district.
The number of fatalities in the West Midlands over the last three years did decrease by 20% between 2020/21 and 2022/23. But the astronomical fatality rate is still far and above everywhere else in the UK.

Cyclist car fatalities National UK Figures
Scotland
Cyclist Road Collisions statistics for Scotland
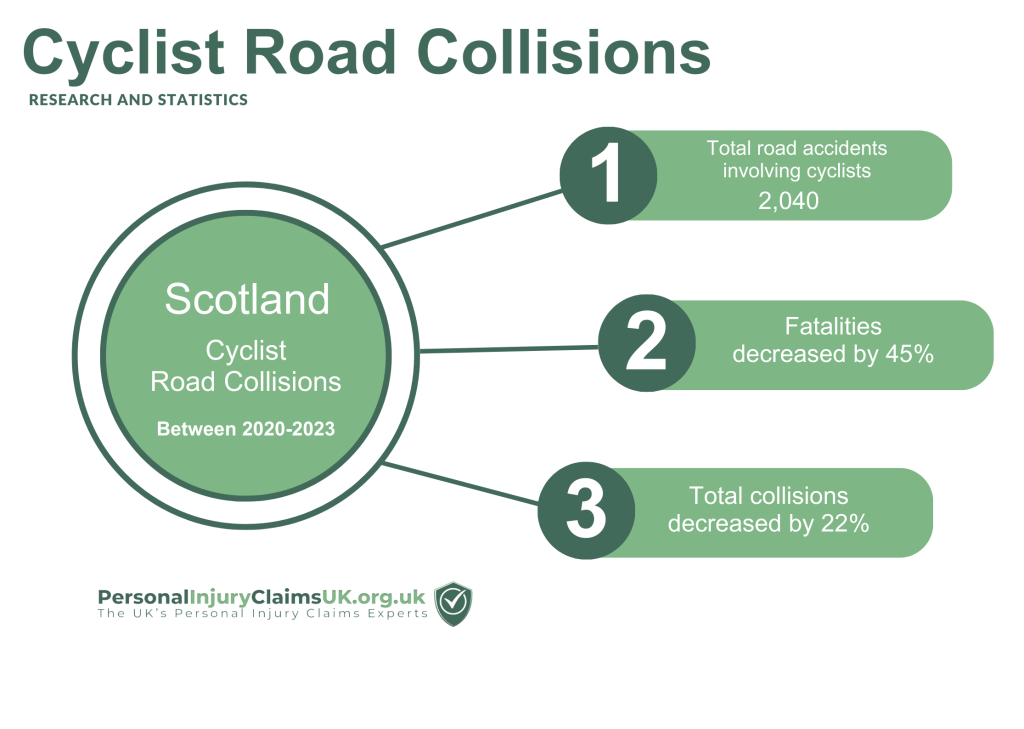
The number of cyclists killed on Scotland’s roads has ranked second highest in the UK.
Despite improvements to figures, Scotland reported a staggering 31 cyclist deaths in the last three years.
Since 2020, 426 cyclists have died in road collisions in the UK, according to government statistics. Scotland makes up 7% of national figures and is followed by Hertfordshire, which accounts for 6% of fatalities.
But the number of biker fatalities has been steadily declining across the nation in the past three years, with 141 reported in 2020, compared to 93 last year, 2023 and Scotland is in keeping with the trend.
Police Scotland reported a total of 20 deaths between 2020 and 2021. The following years, 11 cyclist fatalities were confirmed between 2022/23.
The number of riders who sustained serious injuries decreased from 453 reported in 2020/21 to 344. Similarly, those who suffered slight injuries went down from 674 to 538.
Overall collisions between cyclists and cars on Scottish roads totaled 2,040 over the past three years.
Greater Manchester

Cyclist Road Collisions for Great Manchester
The number of cyclists killed on roads in Greater Manchester has ranked 5th in the UK, matching figures provided for Greater London.
Despite some improvements to figures the area reported a total of 20 cyclist deaths in the last three years.
It is one of the few areas in the UK to report an increase in the amount of cyclists who sustained serious injuries following a collision with a car.
Figures rose by 14% between 2020/21 and 2022/23, according to Greater Manchester Police (GMP).
Serious injuries, often called catastrophic injuries, are those that have a significant and long-term impact on the life of the injured person and their family.
Since 2020, 426 cyclists have died in road collisions in the UK, according to government statistics. Greater Manchester makes up 5% of national figures, matching the number of fatalities reported by the Met Police for Greater London.
The number of cyclist fatalities has been steadily declining across the nation in the past three years, with 141 reported in 2020, compared to 93 last year, 2023.
In spite of its national ranking, Great Manchester figures have shown some promise with the number of fatalities decreasing from 12 in 2020/21 to 8 recorded deaths between 2022/23.
Similarly, the number of riders who suffered slight injuries dropped to 572 from 661. Overall collisions between cyclists and cars on Greater Manchester roads totaled 1,687 over the past three years.
Avon and Somerset

Avon & Somerset cyclist road collision figures
Bedfordshire

Bedfordshire cyclist road collision figures
Cambridgeshire
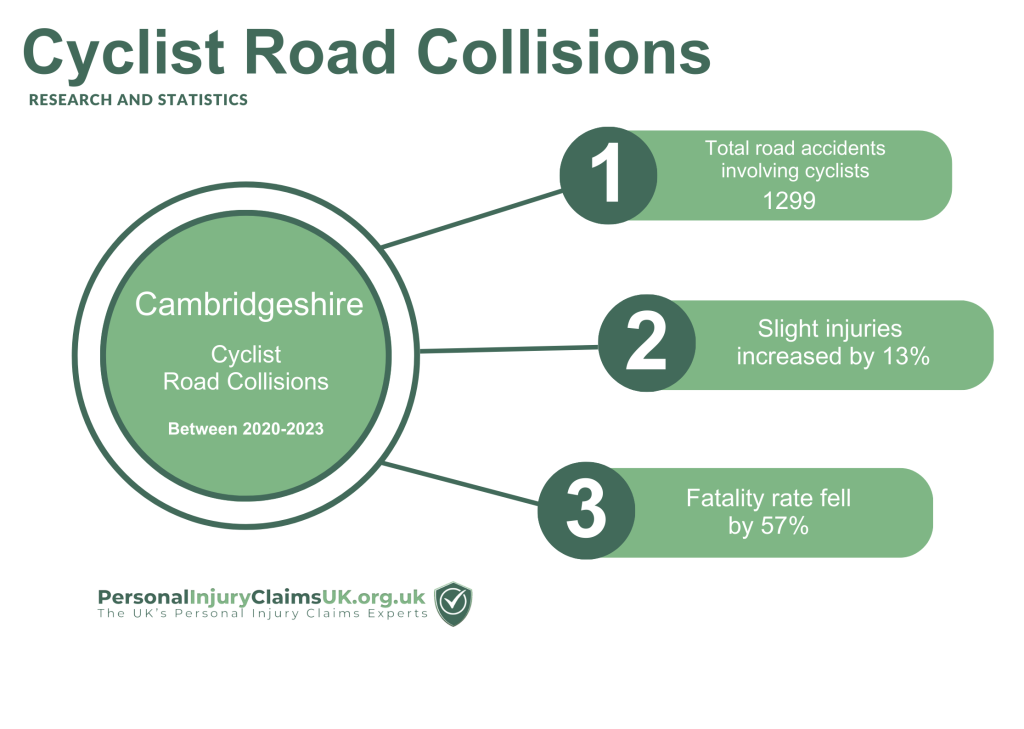
Cambridgeshire cyclist road collision figures
Cheshire

Cheshire cyclist road collision figures
City of London

City of London cyclist road collision figures
Cleveland

Cleveland cyclist road collision figures
Cumbria
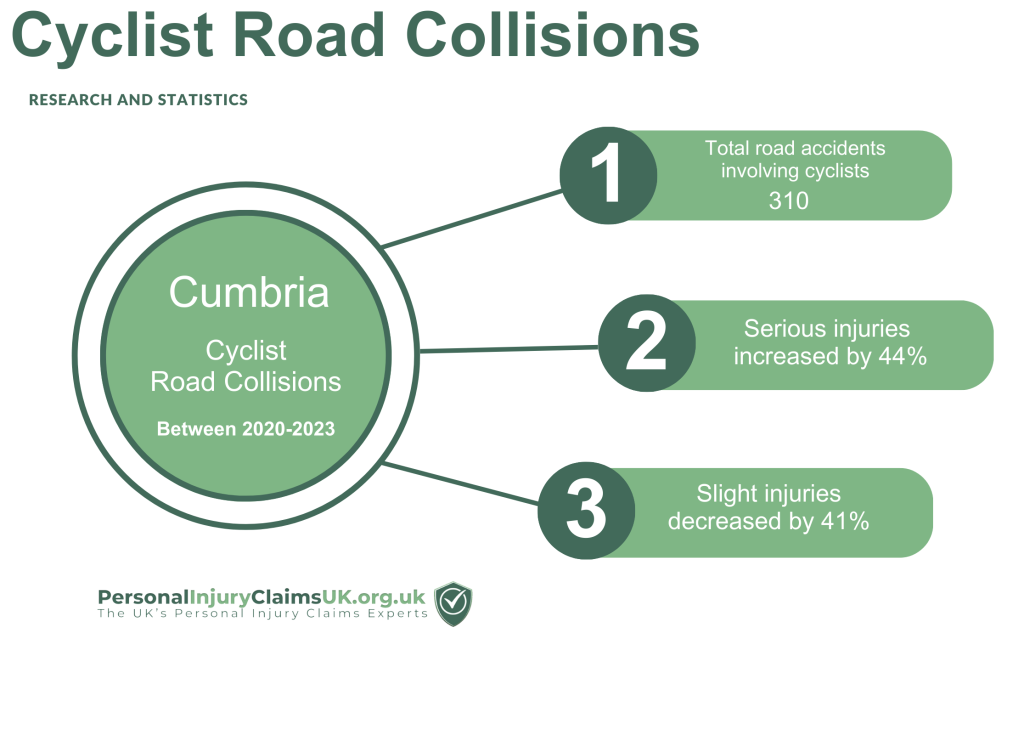
Cumbria cyclist road collision figures
Derbyshire
Derbyshire cyclist road collision figures
Devon & Cornwall

Devon & Cornwall cyclist road collision figures
Durham

Durham cyclist road collision figures
Gloucestershire

Gloucestershire cyclist road collision figures
Gwent

Gwent cyclist road collision figures
Humberside

Humberside cyclist road collision figures
Kent

Kent cyclist road collision figures
Lancashire

Lancashire cyclist road collision figures
Lincolnshire

Lincolnshire cyclist road collision figures
North Wales

North Wales cyclist road collision figures
Northern Ireland
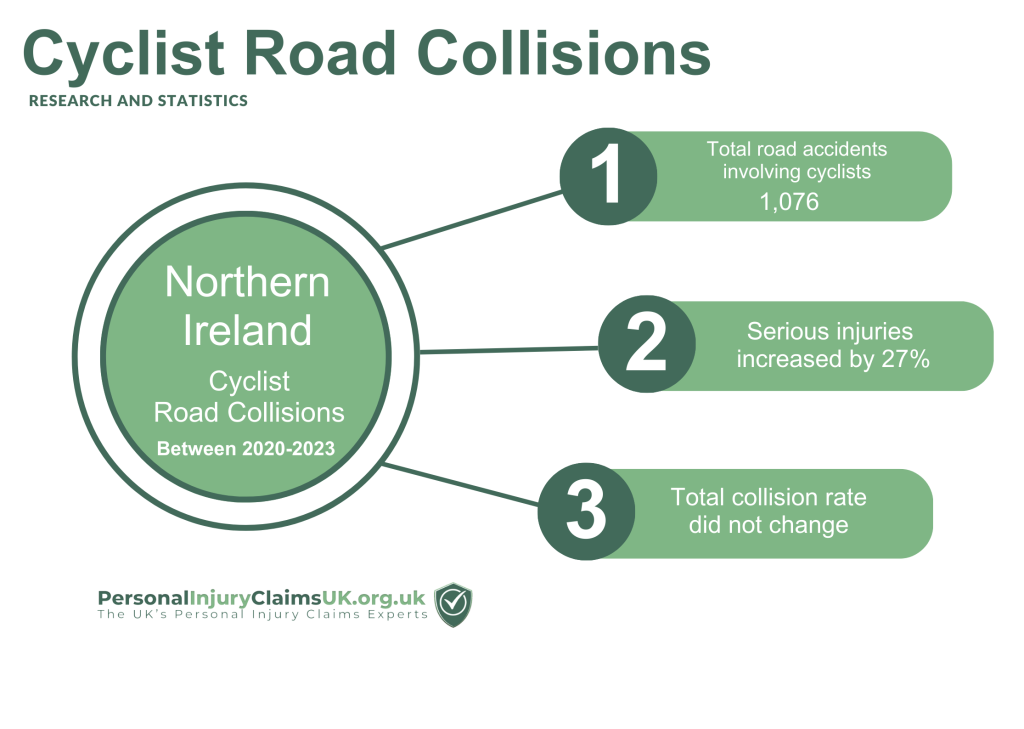
Northern Ireland cyclist road collision figures
Northumbria

Northumbria cyclist road collision figures
Nottinghamshire

Nottinghamshire cyclist road collision figures
Suffolk

Suffolk cyclist road collision figures
Sussex

Sussex cyclist road collision figures
Thames Valley
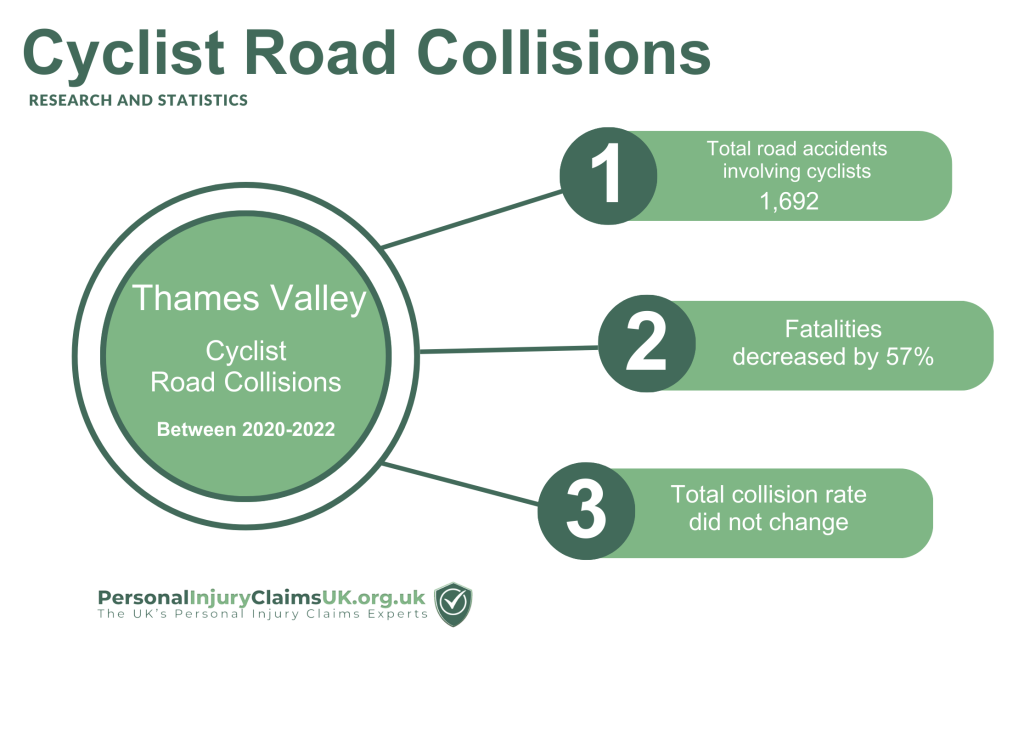
Thames Valley cyclist road collision figures
West Mercia

West Mercia cyclist road collision figures
Wiltshire

Wiltshire cyclist road collision figures