Employers must provide a safe working environment. Unfortunately, accidents do happen whether or not they could have been prevented.
Personal Injury Claims UK set out to find the areas in the UK where the most non-fatal accidents at work have been reported.
These included things like trips and slips, violence or falling from heights.
We analysed the latest data from the HSE (Health and Safety Executive) to uncover which areas accident reports were most prevalent in the UK.
See our findings below. Is your area listed? Do check back on this page as we are constantly updating with our latest research.
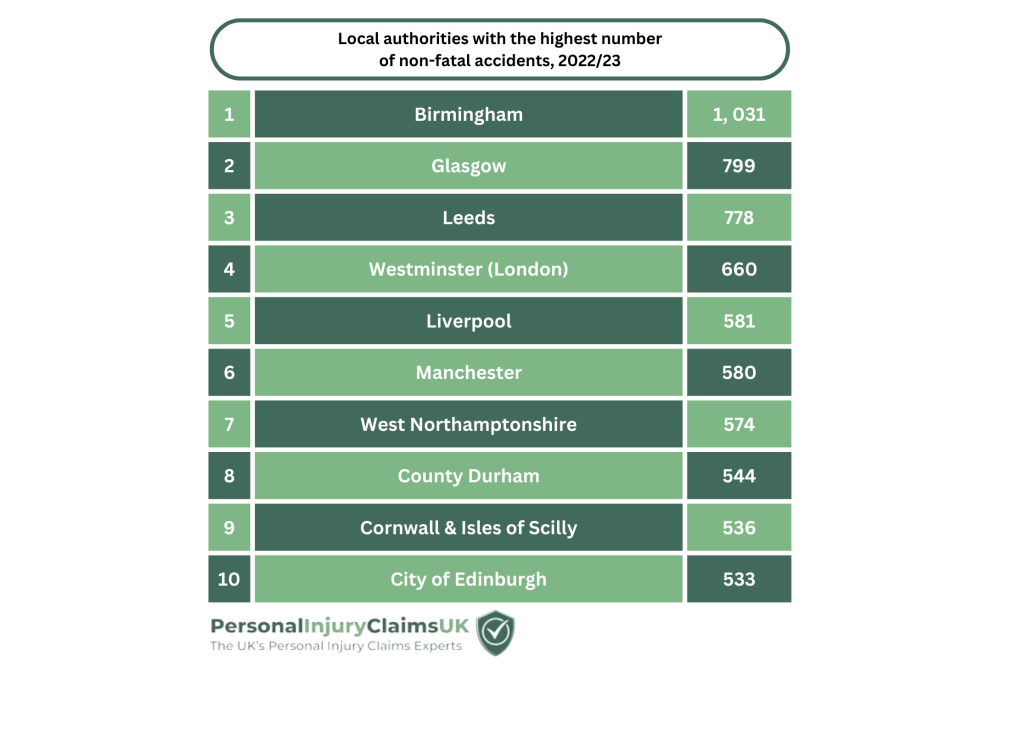
Areas with the most workplace injuries in the UK
Birmingham
Birmingham is the most likely place for someone to suffer injuries at work in the UK with more than 1,000 employees reporting workplace harm in the last year alone.
Figures account for one-fifth of all workplace injuries reported in the last 5 years, with a total of 5,146 non-fatal accidents logged between 2018 and 2023.
What’s more, the true number could be even higher, as employers are not required to report injuries that keep employees out of work for fewer than seven consecutive days.
The most common workplace accidents are slips, trips and falls which account for 32% of all reports. 17% of accidents are from heavy lifting or carrying, while 11% are caused by being struck by a moving object.
Those working in the health and social work industry are the most likely to suffer injuries, according to the Health and Safety Executive (HSE).
Figures for last year show that the manufacturing and transportation industries are second and third for the most reported non-fatal accidents in the UK.
The amount of injuries in Birmingham for 2022/23 is lower than in three of the previous four reporting periods, including a recent high of 1,141 in 2018/19.
However, it represents a 20% increase on the 860 non-fatal incidents tallied during the pandemic-impacted 2020/21 time frame.
The figures indicate around 187 injuries were sustained per 100,000 employees in Birmingham, a lower rate than in other cities including Glasgow, Cardiff and Wolverhampton.
Glasgow
Glasgow employees were more at risk of injuries at work in 2022/23 than at any point since before the Covid-19 pandemic.
The city is second only to Birmingham for workplace injuries in the UK, with 4,032 flagged to the Health and Safety Executive.
That figure includes 799 incidents in 2022/23, an increase on the 743 reported in 2021/22.
It also represents a 19% rise in reports compared to the pandemic-affected 2020/21 period.
Our findings come fresh off the back of MSPs dismissing the Scottish Employment Injuries Advisory Council Bill, which was proposed as a way of supporting those living with workplace injuries.
But it was swiftly rejected by Holyrood’s Social Justice and Social Security Committee, with Labour MSP Paul O’Kane dissenting.
Around 190 injuries were flagged per 100,000 employees in Glasgow, a rate significantly higher than Edinburgh and Aberdeen, and above large English cities including Newcastle and Birmingham.
Leeds
Leeds is the third most likely place for someone to suffer injuries at work in the UK, despite injury numbers dropping in the past year.
778 non-fatal accidents were reported by employers in the Leeds local authority region.
The figure is 118 clear of Westminster, the area immediately behind Leeds on the list. Only Glasgow and Edinburgh posted higher numbers in that period.
In total, Leeds employees flagged 3,817 workplace injuries in the last five years, between 2018 and 2023.
The 2022/23 numbers represent a 35% increase in comparison to the pandemic-affected 2020/21 period.
However, 14 fewer incidents were brought to light by employers than the 792 reported in 2021/22.
With around 186 injuries flagged per 100,000 employees in 2022/23, Leeds workers are statistically more likely to suffer workplace harm than those in other cities such as Manchester, Newcastle or Nottingham.
Westminster
Westminster employees suffered more injuries at work than any other London borough in the past two years.
The city is the fourth-highest for workplace injuries in the whole of the UK.
A total of 600 non-fatal accidents were reported by employers in 2022/23. It ranks behind Leeds, Glasgow and Birmingham.
The most common workplace accidents are slips, trips and falls which account for 32% of all reports. 17% of accidents are from heavy lifting or carrying, while 11% are caused by being struck by a moving object.
Westminster sits far ahead of Hillingdon, Camden, Lambeth and Hounslow among London boroughs. The city also saw 102 more cases of workplace injury reported than in 2021/22, the last reporting period.
What’s more, the rate of 196 injuries per 100,000 employees reveals a significant increase on the 129 per 100,000 posted last time out.
Overall, 3,066 workplace injuries have affected Westminster employees from 2018 to 2023, placing it fifth in the UK list.
Another concerning statistic is the 104% rise in reported incidents since the pandemic-affected 2020/21 period, a much higher increase than many similarly-sized local authority areas.
Liverpool
Liverpool ranks as one of the top five cities in the UK for injuries reported by workers. This is despite a drop in figures over the last year.
The city’s employees reported 581 non-fatal injuries in 2022/23. It ranks behind Leeds, Glasgow and Birmingham.
Manchester saw just one fewer injury logged in the same period but its rate of 134 incidents per 100,000 employees is significantly lower than Liverpool’s 202.
In fact, a worker in Liverpool was statistically more likely to suffer harm than those working in Birmingham, Glasgow or Leeds between 2022 and 2023.
A total of 2,988 non-fatal injuries were reported from 2018 to 2023. The latest numbers are lower than the 655 reported in 2018/19, but also represent a 25% increase on the 464 flagged during the pandemic-affected 2020/21 period.
Cornwall
More workplace injuries occur in Cornwall than anywhere else in the South West, according to the latest figures.
At 536, the number of non-fatal accidents reported by employers in 2022/23 was the ninth-highest in the UK.
Out of the UK local authorities, only the London borough of Westminster posted more reports than Cornwall & the Isles of Scilly across the south of England.
In the South-West, Cornwall employers flagged over 100 injuries more than those in Bristol, and significantly more than counties including Wiltshire, Buckinghamshire and Northumberland.
240 injuries were reported per 100,000 employees in Cornwall & the Isles of Scilly. Only two of the top ten areas for reported accidents in 2022/23 noted a higher rate.
It also marks a 9% increase on the 492 reports sent in by employers in 2021/22. None of the other top ten areas for 2022/23 incidents noted a rise in numbers.
In total, 2,745 non-fatal accidents involving employees from Cornwall & the Isles of Scilly occurred from 2018 to 2023.
Durham
Workplaces in County Durham reported 544 non-fatal accidents in 2022/23.
Only West Northamptonshire, the London borough of Westminster, and five cities posted higher figures in the same time frame.
The statistics also show an 11% increase in reports compared to 2021/22, which itself saw a rise after the pandemic-impacted 2020/21 period.
It does, however, represent a drop in reports compared to 564 in 2018/19 and 556 in 2019/20.
267 incidents were reported per 100,000 Durham employees in 2022/23. That figure suggests a much higher statistical likelihood of injury than in the likes of Newcastle, Birmingham or Glasgow.
West Northamptonshire
West Northamptonshire finds itself among the 10 top local authority regions for workplace accidents, according to a recent study.
Employers reported 574 non-fatal accidents in 2022/23 alone.
The region, which accounts for towns including Northampton and Daventry, saw more injuries reported in that period than Peterborough and Milton Keynes combined.
Only the London borough of Westminster and major cities including Birmingham and Glasgow noted higher numbers.
Statistics show that 286 non-fatal injuries are reported per 100,000 employees, a rate far outstripping any other region in the top ten for total incidents.
West Northamptonshire, unlike most other local or unitary authorities, only saw a very small increase in reports compared to the pandemic-impacted 2020/21 reporting period. 546 non-fatal incidents were flagged in 2020. The latest figures actually represent a drop from the 586 reported in 2021/22.
In total, West Northamptonshire employers have made workplace health and safety authorities aware of 2,922 non-fatal incidents since 2018.
From 2018 to 2023, 317 accidents were reported per 100,000 employees. In comparison, Liverpool flagged 66 more injuries, but at a rate of just 198 per 100,000 workers.
Edinburgh
533 non-fatal accidents were reported by City of Edinburgh employers in 2022/23.
That figure puts Edinburgh 10th across all of the UK, and only behind Glasgow in the Scottish list.
However, a rate of 164 injuries per 100,000 employees suggests that Edinburgh workers are statistically safer than eight of the other members of the top ten.
Additionally, the number of incidents fell from the 542 reported in 2021/22. However, it represents a 36% increase in the 391 accidents flagged during the pandemic-affected 2020/21 period.
Unlike all of the other top ten for non-fatal incidents, Edinburgh’s 2022/23 numbers are higher than those posted in the pre-lockdown 2019/20 period (525.)
Since 2018, Edinburgh employers have reported 2,560 non-fatal injuries to employees. Workplace safety reporting regulations mean not all incidents have to be officially flagged, so the true number of accidents is likely to be higher.
Manchester
Manchester ranks as one of the top cities in the UK for injuries reported by workers.
More than 500 non-fatal workplace injuries were reported to employers in 2022/23. The city comes behind Liverpool, Westminster, Leeds, Glasgow and Birmingham.
A total of 580 injuries were logged, representing a 26% increase in incidents flagged during the pandemic-affected period between 2020/21.
However, figures were significantly less than pre-Covid records when 802 injuries were reported in 2018/19.
In fact, Manchester’s rate of injuries makes it statistically one of the UK’s safest areas. 134 injury reports were made per 100,000 employees, a figure far lower than the likes of Birmingham, Glasgow and Leeds.
North Wales
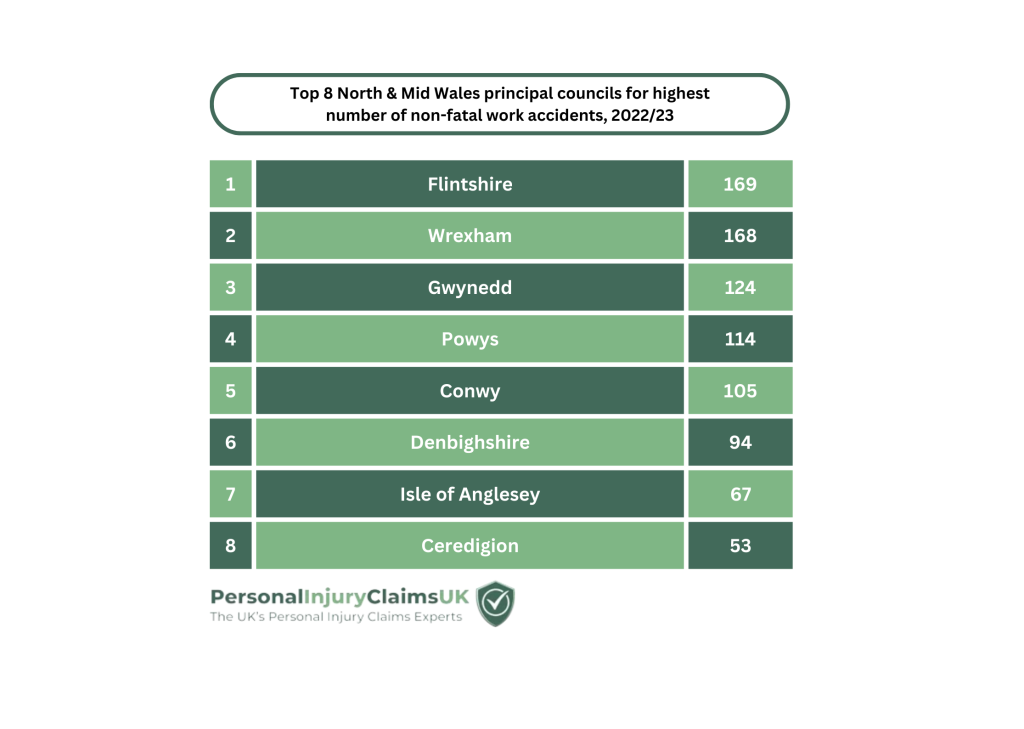
Flintshire ranked highest for workplace injuries in North and Mid Wales
Flintshire is the most dangerous place to work in North or Mid Wales, according to recent statistics.
Employers reported 169 non-fatal accidents in 2022/23, the highest number for North or Mid Wales.
It is closely followed by Wrexham, with 168 reported incidents. Gwynedd follows in the list with a total of 124 reports.
Ceredigion reported just 53 incidents, 12 fewer than the Isle of Anglesey. It can lay claim to being the safest principal council area in Wales, with only 166 injuries per 100,000 employees.
As well as posting the highest number of non-fatal accidents, Flintshire also had the worst rate of incidents by a distance. Its 330 injuries reported per 100,000 employees were comfortably clear of Isle of Anglesey’s 288.
947 non-fatal injuries were flagged in Flintshire from 2018 to 2023. While it is the most likely place for an employee to be injured in North or Mid Wales, it was the only principal council area where the number of cases did not rise compared with the pandemic-affected 2020/21 period.
In comparison, Conwy’s accident tally doubled, with 52 reports in 2020/21 and 105 in 2022/23.
Workplace injury reporting regulations do not require all incidents to be reported by employers, so the actual number of accidents is likely to be even higher.
South Wales
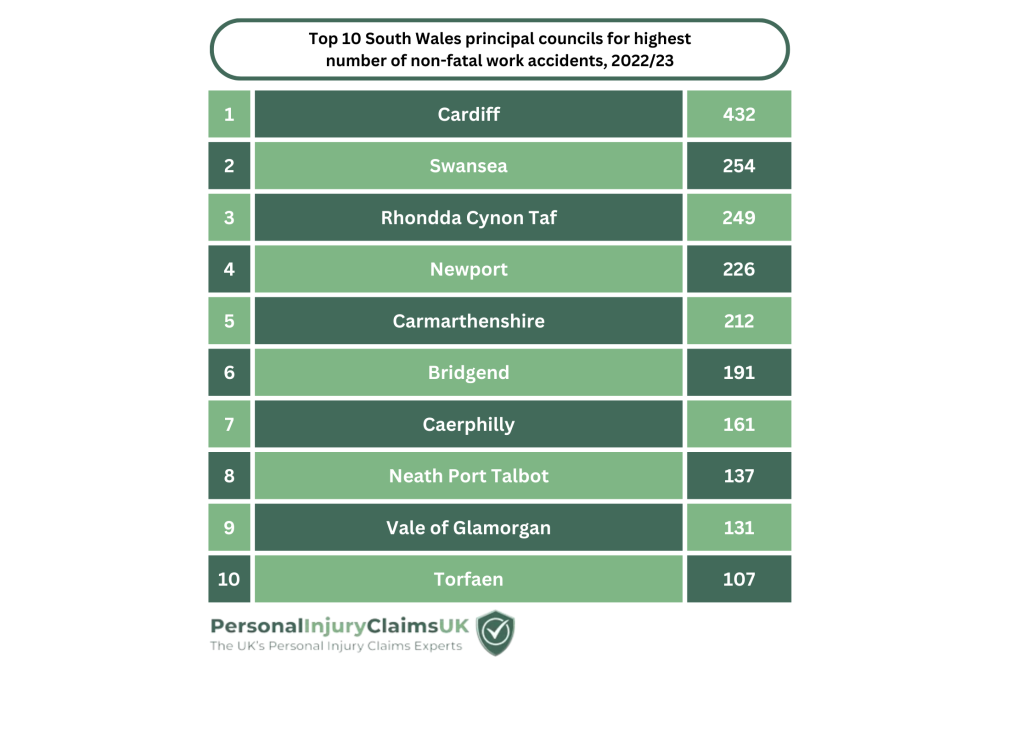
Cardiff ranks top city for workplace injuries in South Wales
Cardiff employees reported the highest number of workplace injuries across South Wales last year.
432 cases were raised to workplace health and safety authorities in 2022/23.
Figures were significantly higher than Swansea, which ranked second in South Wales, with 254 reports.
Rhondda Cynon Taf sits third in the list of South Wales’ principal councils, noting 249 injuries in the workplace.
The highest rate of injury, however, comes from a local authority area not found in the region’s top ten for total incidents. Merthyr Tydfil employers reported 91 non-fatal accidents, at a rate of 404 for every 100,000 employees. In comparison, Cardiff’s rate was 209 per 100,000.
Cardiff saw its total report numbers fall slightly from the 443 flagged in 2021/22, but a 38% rise from the 313 reports in the pandemic-affected 2020/21 period.
2,163 reports came out of Cardiff from 2018 to 2023, followed by 1,307 Swansea accidents and 1,179 from Rhondda Cynon Taf.
Swansea was statistically the safest area, with 204 reported injuries per 100,000 second only to Ceredigion in the entirety of Wales.
The UK average of 242 injuries per 100,000 employees was eclipsed by ten of South Wales’ 14 principal councils.