Gun crime is an ongoing problem in the UK and leaves a devastating trail behind for all involved. Only recently the murder of Olivia Pratt-Korbel, a nine-year-old girl who was shot by a gunman, shocked the nation and proved just how serious of an issue gun crime is in the UK.
We decided to research just how much of an issue gun crime is for each part of the UK in the hope that it would highlight what changes need to be made.
Our Methodology
In order to find out accurate figures on gun crimes across England, Northern Ireland, Scotland and Wales, a Freedom of Information request was sent to all police forces in the UK. We asked for the number of gun crimes in each area policed by the force since November 2020.
The Results Of Our Research Into Gun Crimes In The UK
Below you can find the results of our research into UK gun crimes, broken down by each police force.
Wiltshire Police
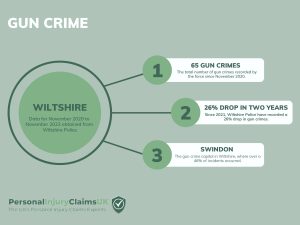
There have been just 65 gun crimes in Wiltshire since November 2020.
Figures obtained from Wiltshire Police found that Swindon was the worst town for gun crime, where 46% of gun crimes occurred during this period.
Chippenham was found to be the second worst town for gun crime and accounted for 8% of incidents.
Trowbridge and Westbury followed behind, accounting for 6% and 5% of incidents, respectively.
The towns with the least amount of incidents were Amesbury, Bradford On Avon, Devizes, Fovant, Heddington, Ludgershall, Marloborough, Melksham, Pewsey, Royal Wootton Bassett, Salisbury and Tidworth.
Just one incident had occurred in each of these towns since November 2020.
Further data received from Wiltshire Police via a Freedom of Information request revealed that gun crime had dropped by 26% since 2021.
In the last year alone, there had been a drop by around 6%.
Greater Manchester Police
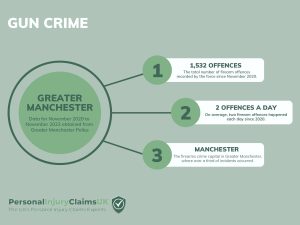
A firearm offence has happened every day in Greater Manchester since 2020.
Figures obtained from Greater Manchester Police revealed that a total of 1,532 firearm offences had occurred in the region between November 2020 to November 2023.
More firearm offences happened in Manchester than any other city or town in the region, where a third of all offences recorded by GMP occurred.
Manchester’s northern district was the worst area for firearm offences, with a total of 225 offences recorded in the past three years.
The cities and towns with the highest rates of firearm offences included:
- City of Manchester – 31%
- Salford – 12%
- Wigan – 9%
- Oldham – 9%
- Bolton – 8%
The figures depict crimes where a firearm has been used to endanger life, or where a suspect has been found in possession of firearms with or without intent.
North Wales Police
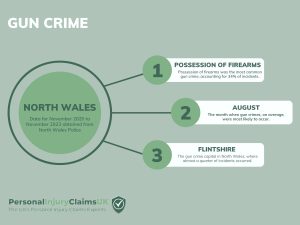
Flintshire is the gun crime capital of North Wales.
Figures obtained from North Wales Police revealed that almost a quarter of all gun crime incidents occurred in Flintshire between November 2020 to November 2023.
Wrexham and Conwy also had high rates of gun crime, with the towns accounting for 18% and 17% of all incidents, respectively.
Following behind was Denbighshire (16%), Gwynedd (14%) and Anglesey (10%).
On average, gun crimes were more likely to happen in August than any other month.
The most common gun crime reported to North Wales Police was possession of firearms, which made up 34% of all incidents.
Assault without injury was the second most reported gun crime, accounting for 18% of incidents.
Surrey
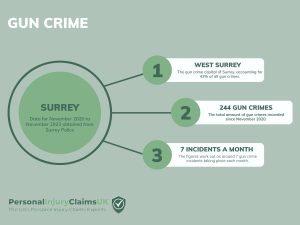
West Surrey is the gun crime capital of Surrey.
Figures obtained from Surrey Police found that since November 2020, around 43% of all gun crimes have occurred in West Surrey.
Guildford, which is also located in West Surrey, had more gun crimes than any other borough during this period.
Almost 18% of gun crimes occurred in Guildford.
East Surrey was the area with the second highest rate of gun crimes.
A third of gun crimes occurred in East Surrey, with Reigate and Banstead being the worst borough in the area for gun crimes (11%).
North Surrey was where the least gun crimes occurred (27%).
However, Spelthorne, which is located in North Surrey, accounted for 11% of gun crimes recorded by Surrey Police.
Derbyshire
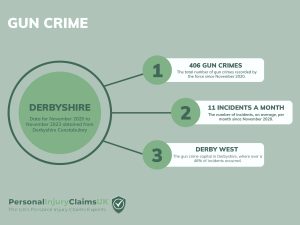
Crimes involving firearms are more likely to happen in Derby West than any other district in Derbyshire.
Out of 406 incidents recorded by Derbyshire Constabulary from November 2020 to November 2023, around 17% occurred in Derby West.
Derby North had the second highest rate of crimes where firearms were deployed or where imitation of firearms were involved.
The district made up 14% of incidents recorded by the force in this period.
Following behind was North East Derbyshire District, accounting for 13% of incidents.
Amber Valley and Derby East rounded up the top five of districts with highest rates of firearm crimes, with both districts making up around 12% of incidents.
Derbyshire Dales had the lowest rate of incidents followed by Derby South (both around 4%).
Essex
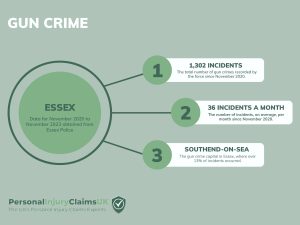
Southend-On-Sea has the highest rate of firearms offences in Essex.
Essex Police confirmed that there had been 1,320 firearm offences since November 2020.
This works out as 36 firearm offences happening every month.
Over 13% of incidents occurred in Southend-On-Sea, followed by Thurrock, where 12% of incidents were reported.
Other areas with high rates of firearm offences included Basildon (11%), Colchester (10%) and Tendring (9%).
The least amount of incidents occurred in Maldon, where less than 3% of firearm offences were reported.
Each area of Essex can be found below and is ranked by the amount of firearm offences:
- Southend-On-Sea – 176
- Basildon – 145
- Thurrock – 160
- Colchester – 128
- Tendring – 113
- Epping Forest – 99
- Chelmsford – 98
- Braintree – 93
- Harlow – 82
- Uttlesford – 59
- Castle Point – 49
- Brentwood – 42
- Rochford – 38
- Maldon – 35
- Other/Unknown – 3
Gloucestershire

There were 44 firearms offences reported since November 2022.
More incidents occurred in Gloucester than anywhere else, followed by Cheltenham, Tewkesbury and Forest.
The least amount of incidents occurred in the Cotswolds.
Leicestershire
The city of Leicester accounts for almost 50% of all gun crime in Leicestershire.
Out of 777 incidents recorded by Leicestershire Constabulary between November 2020 to November 2023, 48% occurred in the city.
Charnwood and North West Leicestershire held the second and third highest number of gun crime figures, according to a Freedom of Information request submitted to the force.
Here is a breakdown of figures with the most recorded incidents of gun crime in Leicestershire Council Areas:
- Leicester City Council 48%
- Charnwood Borough Council 12%
- North West Leicester District Council 11%
- Hinckley and Bosworth Borough Council 7%
- Blaby District Council 6%
- Melton Borough Council 5%
- Harborough District Council 5%
- Oadby and Wigston Borough Council 3%
- Rutland County Council 1%
West Midlands
Birmingham gun crime accounts for half of the entire West Midlands figures.
Overall, an average of 2 gun crimes happen every day across the region.
A staggering 2,693 gun crimes have been recorded by West Midlands Police between November 2020 to November 2023, the majority of which happened in Birmingham.
Sandwell came second on the list, accounting for 11% of recorded gun crimes, followed by Dudley.
1,341 gun crimes were reported in Birmingham, according to data obtained via a Freedom of Information request to the force.
Breakdown of figures with the most recorded incidents of gun crime the West Midlands
- Birmingham 50%
- Sandwell 11%
- Dudley 9%
- Wolverhampton 9%
- Coventry 9%
- Walsall 8%
- Solihulll 4%
Metropolitan Police
An average of 4 gun crimes happen a day across London.
Across the capital, 4,369 gun offences have been recorded by Police between November 2020 to November 2023.
Most firearm crimes happened in Lambeth, according to a Freedom of Information request submitted to Metropolitan Police.
Haringey saw the second most offences, followed closely by Kensigton and Chelsea.
Worst London Boroughs for gun crime in that last three years
- Lambeth 277
- Haringey 249
- Kensington & Chelsea 224
- Southwark 218
- Brent 214
If you’re looking for advice on making a claim through the CICA for a gun crime injury or another type of criminal injury, you can contact Personal Injury Claims UK for free today.