Knife crime is a prevalent issue in UK society. Such crimes can cause serious injuries including deep cuts and puncture wounds and they may also be used in crimes involving grievous bodily harm (GBH).
Our research dives into the seriousness of the issue. Below, we look at the current rates and statistics for each part of the UK. We detail our first-hand research and what steps are being taken by police and the government to address the problem.
In October, the government published a report on knife crime statistics in which it reviewed figures taken from the Office for National Statistics (ONS).
In the year that ended in March 2023, 50,500 offences were recorded. This figure appears to be rising, with the total offences in 2020/21 at around 44,000.

Our Research Into Knife Crime In The UK
While the ONS figures make for interesting reading, they’re quite general and reflect the country as a whole. It does not break it down by area.
Our own research, on the other hand, offers breakdowns by geographical area. Below, you can browse through our research below:
Merseyside
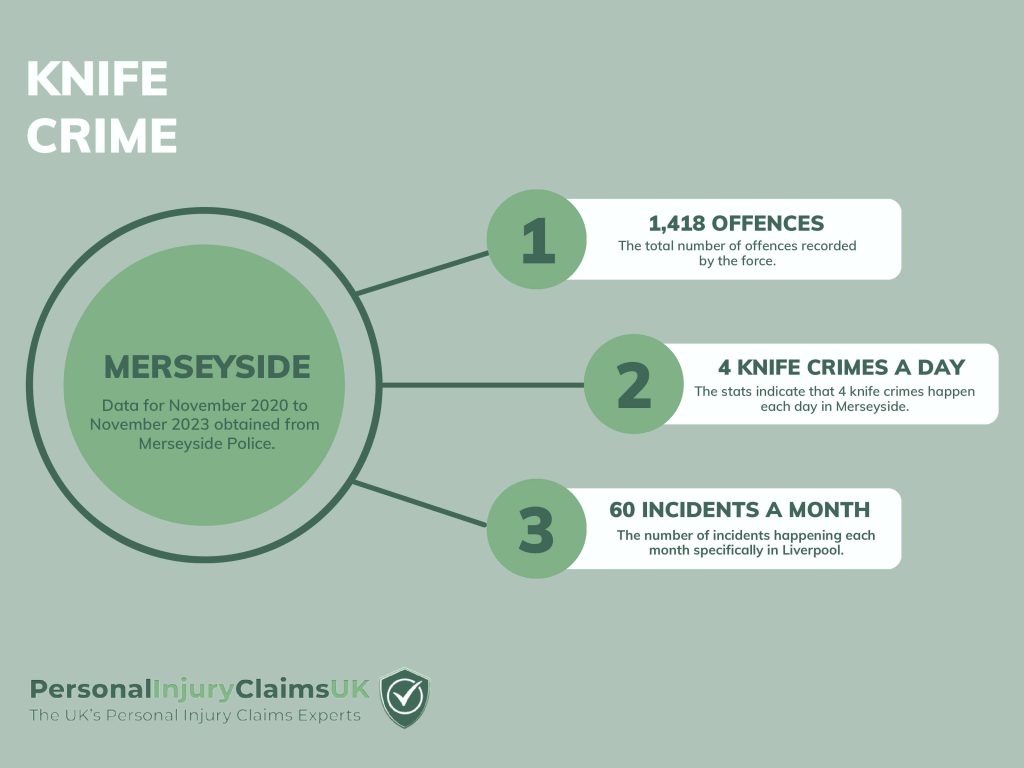
Around four knife crimes happen each day in Merseyside.
Figures obtained from Merseyside Police via a Freedom of Information request revealed that 1,418 knife crimes have taken place since last November.
More knife crimes occurred in March than any other month during this period, when 146 incidents were recorded by Merseyside Police.
Liverpool had the highest rates of knife crimes, with 60 incidents happening each month.
However, further data received from Merseyside Police indicated that in the last three years, knife crime rates were decreasing overall in Merseyside.
Overall, there has been an 11% drop in knife crimes since November 2020.
Wiltshire
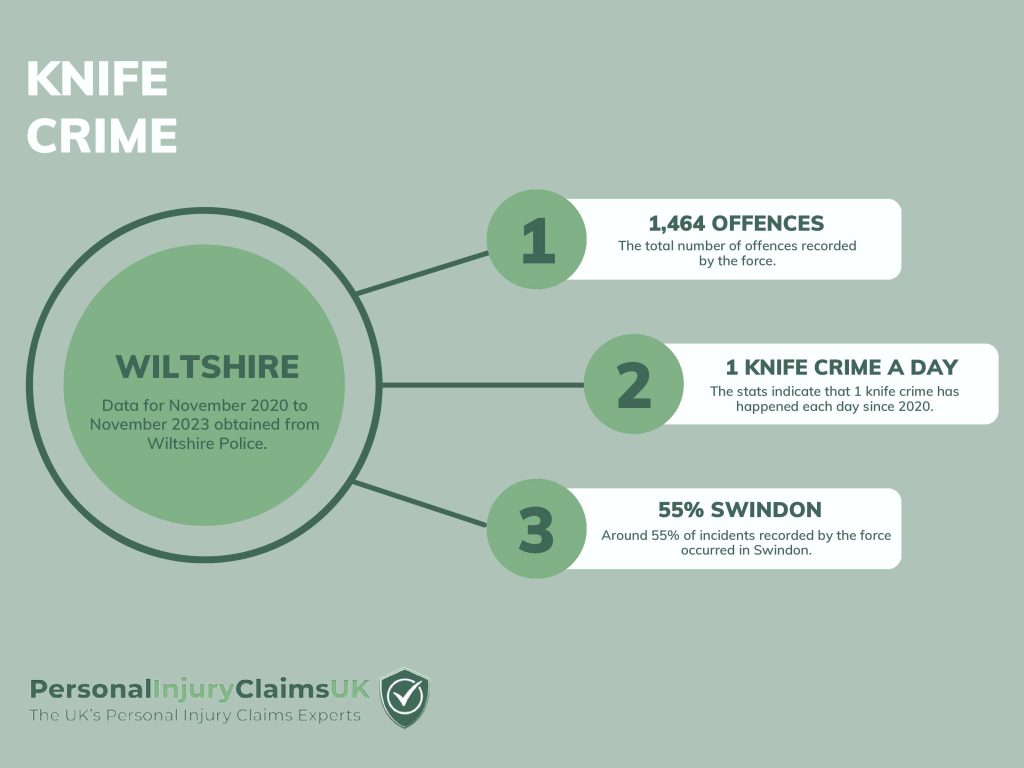
A knife crime has happened every day in Wiltshire for the last three years.
Figures obtained from Wiltshire Police via a Freedom of Information request found that 1,464 knife crimes had occurred overall since November 2020.
A further 13% of incidents occurred in Trowbridge.
Other towns with high rates of knife crimes included Salisbury, where a tenth of incidents took place.
Towns with low rates of knife crimes included Chippenham (7%), Devizes (5%), Amesbury (4%), Warminster (4%) and Royal Wootton Basset (3%).
North Wales
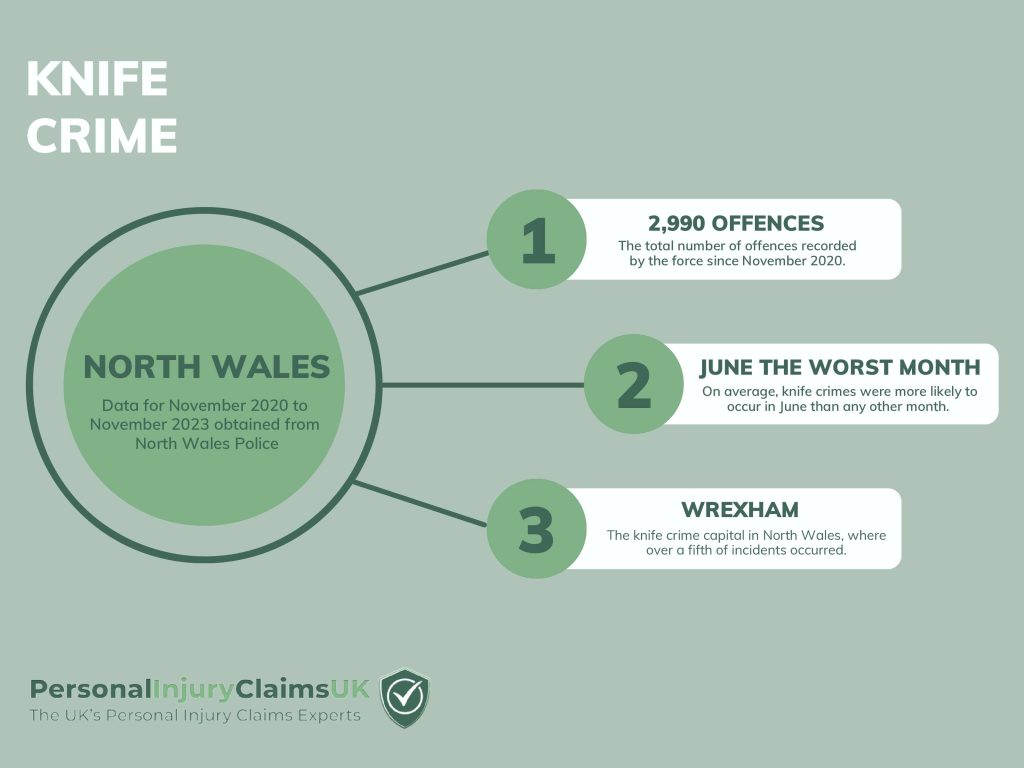
Wrexham has been revealed as the knife crime capital of North Wales.
A Freedom of Information request made to North Wales Police revealed that a total of 2,990 knife crimes had occurred from November 2020 to October 2023.
Over a fifth of incidents recorded by the force occurred in Wrexham, making it the area with the highest rates of knife crimes in North Wales.
A full breakdown of each area can be found below:
Wrexham – 623
Denbighshire – 605
Flintshire – 599
Conwy – 532
Gwynedd – 406
Anglesey – 220
Further data obtained from North Wales Police found that, on average, knife crimes were more likely to happen in June than any other month.
However, since January 2023, the month with the highest number of knife crimes was October.
West Midlands
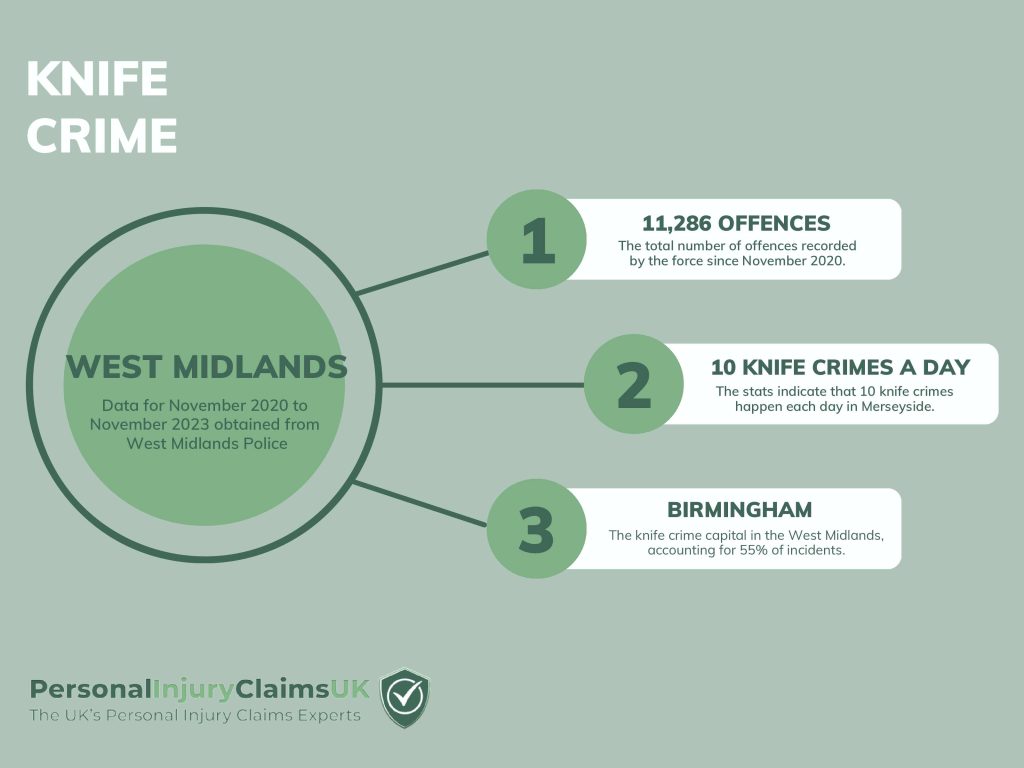
Around 10 knife crimes have occurred each day in the West Midlands since 2020.
Figures obtained from West Midlands Police revealed that 11,286 knife crimes had happened from November 2020 to October 2023
More knife crimes happened in Birmingham during this time, with the city accounting for 55% of all knife crime incidents reported in the West Midlands.
Other towns with high rates of knife crime included Solihull (10.2%), Coventry (9.5%) and Wolverhampton (7.6%).
This year alone, 3,436 knife crimes had occurred, working out as 343 knife crimes happening each month.
Since January, the data found that more knife crimes occurred in March than any other month, when around 11.4% of incidents were recorded by the force.
Other months that had high rates of knife crime included January (11.1%) followed by October (10.9%) and May (10.5%).
The figures also indicated that knife crime has risen in the West Midlands by almost a fifth in the last two years.
Derbyshire
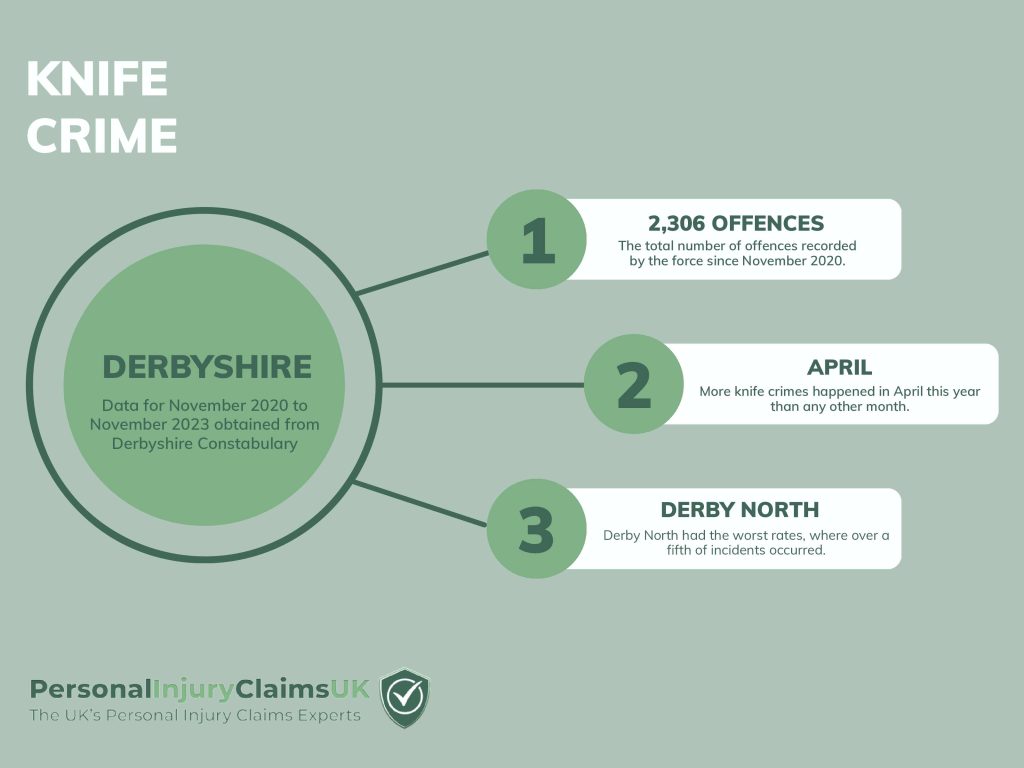
Two knife crimes have happened every day in Derbyshire since 2020.
Figures obtained from Derbyshire Constabulary indicated that there had been a 7% increase in knife crime between November 2020 to November 2022.
Almost a fifth of incidents occurred in Derby North, whilst 17% happened in Derby West.
Areas with high rate of knife crime incidents included:
- Derby North – 20%
- Derby West – 17%
- Derby East – 11%
- Chesterfield – 10%
- Erewash – 10%
This year, more knife crimes occurred in April than any other month, followed by May and September.
Greater Manchester
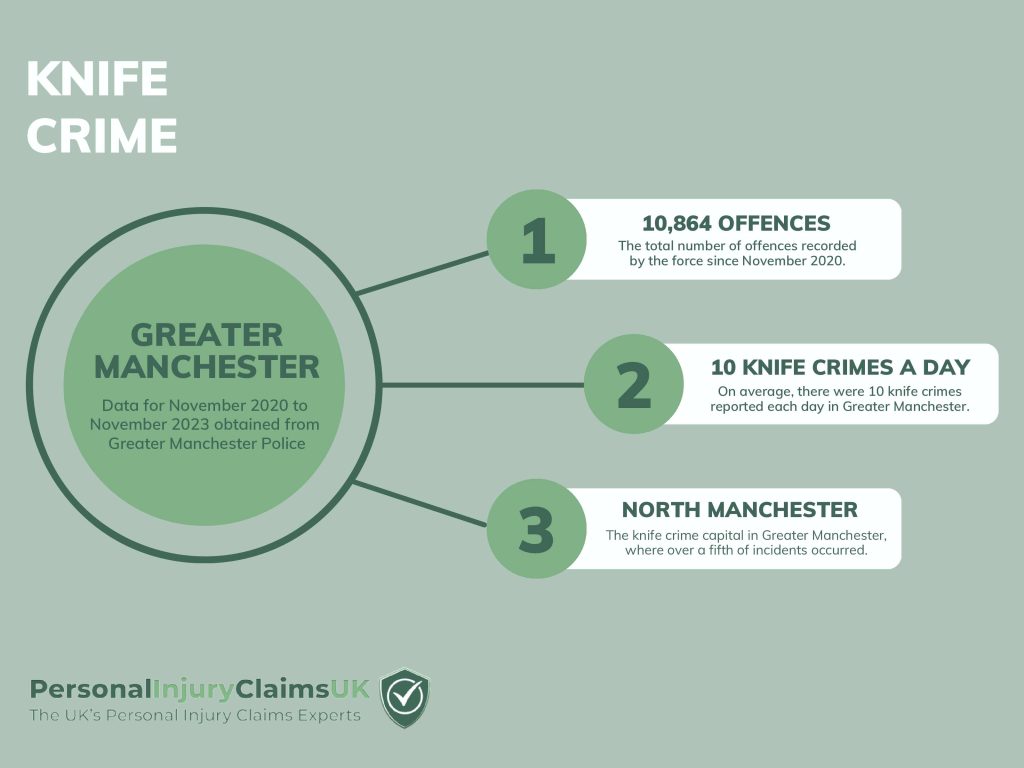
Around 10 knife crimes have happened each day in Greater Manchester since 2020.
Figures obtained from Greater Manchester Police confirmed the number of knife crimes that had occurred in the region between November 2020 to November 2022 totalled at 10,864.
The district policed by the force with the highest rate of knife crimes was North Manchester, where 13% of incidents were reported.
Salford had the second highest rate, where 10.2% of incidents occurred.
The districts or towns with the largest number of knife crimes were as follows:
- City of Manchester North: 13%
- Salford: 10.2%
- City of Manchester Central: 10%
- Bolton: 9.2%
- Wigan: 8.3%
- Rochdale: 8.3%
- Oldham: 8.2%
- City of Manchester South:7.3%
- Tameside: 7.2%
- Stockport: 6.5%
Lancashire

Blackpool has been revealed as the knife crime capital of Lancashire.
Figures obtained from Lancashire Constabulary via a Freedom of Information request found that 8,738 knife crimes have been recorded since November 2020.
This works out as around 8 knife crimes happening every day in Lancashire.
Out of all 8,738 knife crimes, a fifth of incidents occurred in Blackpool.
Other towns with high rates of knife crime in Lancashire included:
- Blackpool – 20%
- Preston – 17%
- Blackburn with Darwen – 10%
- Lancaster – 8%
- Burnley – 7%
- Hyndburn – 6%
- Chorley – 5%
- South Ribble – 5%
- West Lancashire – 5%
- Pendle – 5%
Surrey
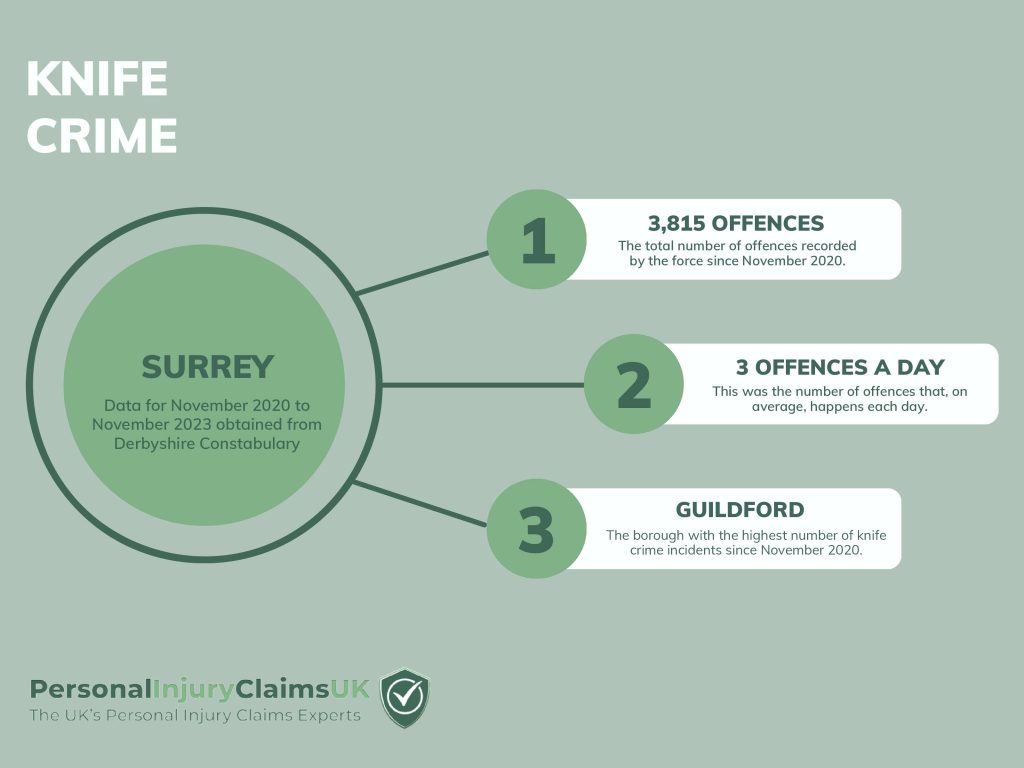
Guildford has the highest rate of knife crimes in Surrey.
According to figures obtained from Surrey Police via a Freedom of Information request, 3,815 knife crimes have occurred since November 2020.
This works out as around 3 knife crimes happening each day in Surrey.
Out of all knife crimes recorded by the force, 503 incidents occurred in Guildford – the highest number compared to other boroughs in Surrey.
Reigate and Banstead followed closely behind, where 493 incidents happened.
Below is a list of each borough in Surrey ranked by number of recorded offences:
- Guildford – 503
- Reigate and Banstead – 493
- Spelthorne – 478
- Elmbridge – 379
- Woking – 370
- Waverley – 318
- Runnymede – 312
- Epsom & Ewell – 290
- Surrey Heath – 252
- Tandridge – 236
- Mole Valley – 214
It’s worth noting that only offences with a knife crime flag have been included in the response from Surrey Police.
Furthermore, the knife flag is applied at the discretion of the officer or police staff member.
Durham

Around 2 knife crimes have happened each day in Durham since November 2020.
Data obtained from Durham Constabulary via a Freedom of Information request revealed that 2,670 knife crimes had occurred in total during this period.
Figures also indicated that knife crime had risen in the past two years by 1.2%.
The most common incident recorded since November 2020 involved either the use or threatened use of a bladed article.
This type of incident accounted for 72% of knife crimes recorded by Durham Constabulary.
The second most common incident type was possession offences.
Kent
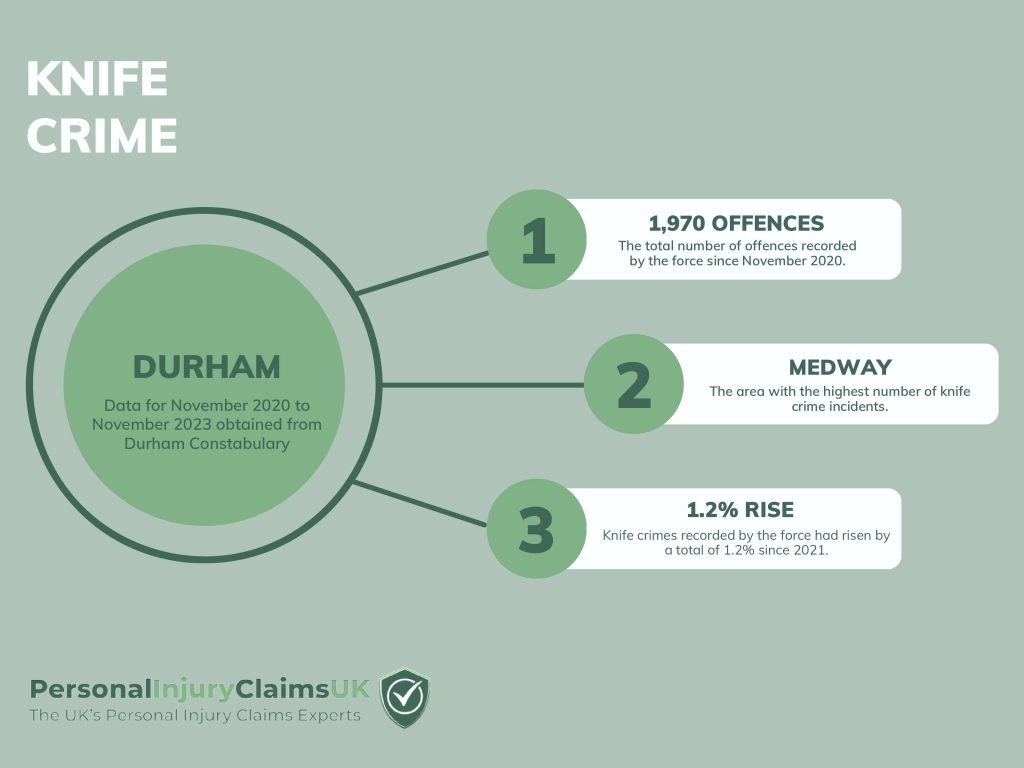
Medway is the worst area for knife crimes in Kent.
Out of 1,970 knife crimes recorded by Kent Police since November 2020, a fifth of incidents occurred in Medway.
Thanet had the second highest rate, accounting for 12% of knife crimes.
Canterbury and Maidstone followed behind, with each district making up around 9% of incidents.
The area with the lowest rate of knife crimes was Tunbridge Wells (4%).
Whilst the number of knife crimes increased from 2021 to 2022 by 1.2%, the current figures indicate that the rate of knife crimes may be decreasing.
Nottinghamshire
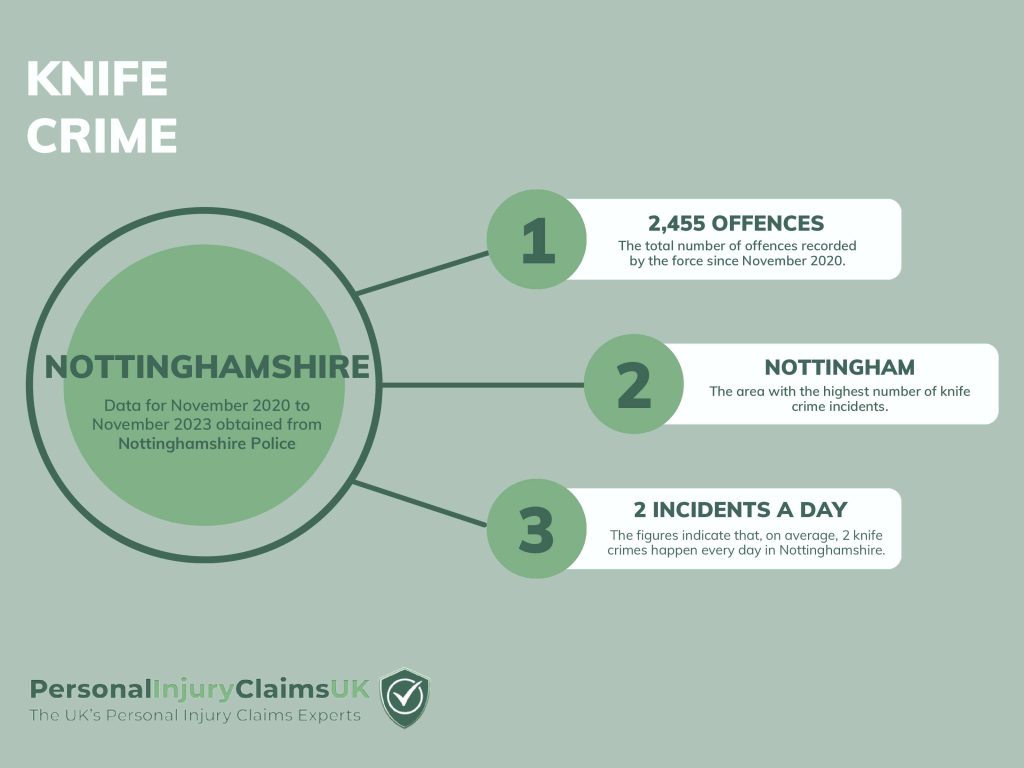
Around two knife crimes have happened every day in Nottinghamshire since 2020.
Figures obtained from Nottinghamshire Police confirmed the total number of knife crimes recorded from November 2020 to October 2023 amounted to 2,455.
Nottingham had the highest rate of knife crimes, accounting for more than half of the incidents that occurred in this period.
Ashfield had the second highest rate, where almost a tenth of incidents happened.
The least amount of knife crimes occurred in Rushcliffe, which accounted for 3% of incidents.
Each district in Nottinghamshire is listed below and ranked in terms of number of knife crimes:
- Nottingham – 1,240
- Ashfield – 232
- Mansfield – 228
- Bassetlaw – 179
- Broxtowe – 155
- Newark and Sherwood – 156
- Broxtowe – 155
- Gedling – 153
- Rushcliffe – 81
- Out of force area – 6
- Not recorded – 25
The figures for Nottingham are broken down by areas below:
- City Central – 347
- City South – 305
- City West – 210
- City North – 206
- City Centre – 172
Essex

Around 14 knife crimes happen each day in Essex.
Essex Police confirmed through a Freedom of Information request that a total of 15,161 knife crimes had occurred from November 2020 to November 2023.
The area with the highest rates of knife crime during this time was found to be Southend-On-Sea, where 14.4% of incidents occurred.
Following closely behind was Basildon, which accounted for 14.2% of incidents.
Other areas with high rates of knife crime included Thurrock (11%), Colchester (10%) and Chelmsford (8%).
The least amount of knife crimes occurred in Maldon, where less than 2% of incidents happened.
Each area of Essex can be found below, ranked by number of knife crimes:
- Southend-On-Sea – 2,194
- Basildon – 2,153
- Thurrock – 1,681
- Colchester – 1,546
- Chelmsford – 1,260
- Tendring – 1,178
- Harlow – 1,073
- Epping Forest – 885
- Braintree – 860
- Castle Point – 597
- Uttlesford – 579
- Brentwood – 424
- Rochford – 384
- Maldon – 289
- Not recorded – 49
- Other police force – 9
Gloucestershire

There were 351 knife crime incidents reported from November 2022.
More knife crime happened in Gloucester, followed by Cheltenham and Forest.
The least incidents occurred in the Cotswolds.
Leicestershire
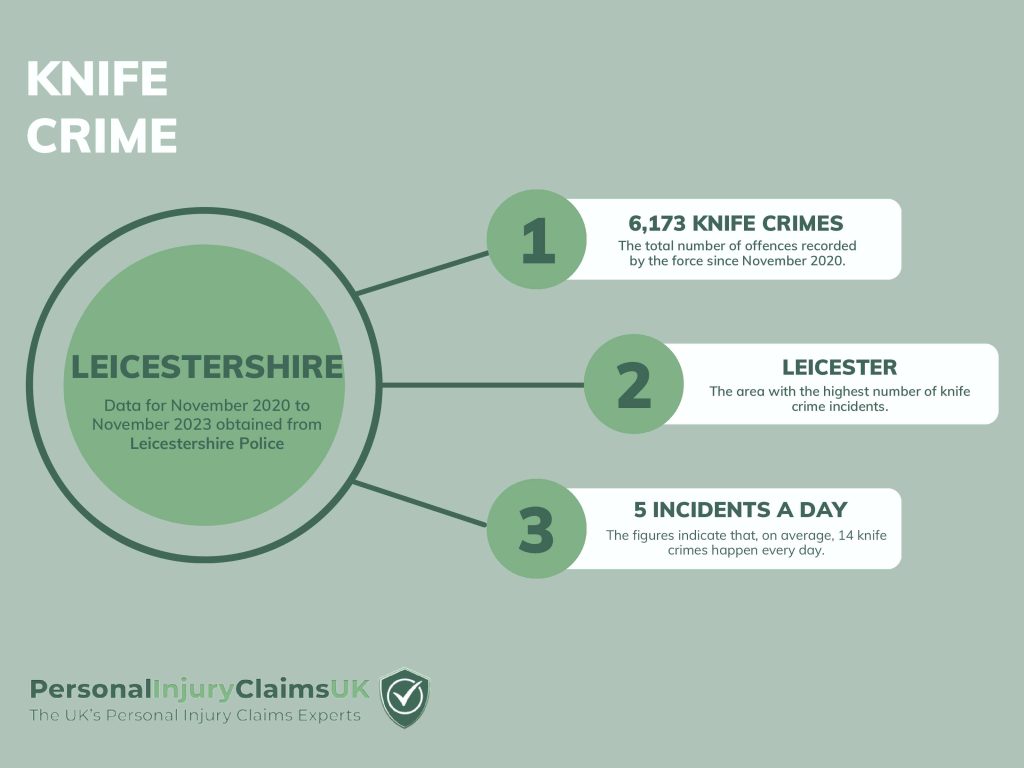
Around 5 knife crimes happen every day in Leicestershire.
Figures obtained from Leicestershire Police confirmed the total number of knife crime amounted to 6,173 since November 2020.
Leicester had the highest rate of knife crime, where more than 60% of incidents occurred.
Other areas with high rates of knife crime included Charnwood, North West Leicestershire, Hinckley and Bosworth and Blaby.
Recently, Leicester welcomed The Peace In Our Streets Emergency Concert in response to ongoing knife crime in the city.
Each council area can be found below alongside the amount of knife crime incidents in the area:
- Blaby District Council – 304
- Charnwood Borough Council – 695
- Harborough District Council – 199
- Hinckley and Bosworth Borough Council – 317
- Leicester City Council – 3752
- Melton Borough Council – 198
- North West Leics District Council 379
- Oadby and Wigston Borough Council – 210
- Rutland County Council – 68
- Unknown – 51
Norwich
According to figures obtained from Norfolk Police via a Freedom of Information request, 4,590 knife crimes have occurred since November 2020.
This works out as around 4 knife crimes happening each day in Norfolk.
Out of all knife crimes recorded by the force, 1,496 incidents occurred in Norwich City – far more than other areas of the county.
Great Yarmouth came out at number two on the list with a total of 830 incidents happening.
Below is each area of Norfolk in accordance with incidents of knife crime over the last three years. (November 1, 2020 – November 1, 2023).
- Norwich City – 1,496
- Great Yarmouth – 830
- Breckland – 620
- Kings Lynn & West Norfolk – 595
- South Norfolk – 413
- Broadland – 334
- North Norfolk – 279
- Unknown – 23
Staffordshire
Stoke on Trent ranks top of the list when it comes to knife crime rates in Staffordshire, new data from PersonalInjuryClaimsUK.org.uk has revealed.
According to figures obtained from Staffordshire Police via a Freedom of Information request, 2,271 knife crimes have occurred since November 2020.
Out of all knife crimes recorded by the force, 996 incidents occurred in Stoke On Trent.
Each area of Staffordshire in accordance with incidents of knife crime over the last three years. (November 1, 2020 – November 1, 2023).
- Stoke on Trent South – 509
- Stoke on Trent North – 487
- Newcastle-Under-Lyme – 244
- East Staffordshire – 231
- Stafford – 172
- Tamworth 153
- Cannock – 144
- Lichfield – 115
- South Staffordshire – 99
- Moorlands – 86
- Unknown 31
Avon & Somerset
Bristol saw around 4 knife crimes every day last year during ‘year of tragedy’
Bristol has been revealed as the knife crime capital of Avon&Somerset policing district.
New figures show the city accounts for a staggering 47% of knife crimes in the area with a total of 4,826 incidents recorded.
Avon & Somerset Police confirmed via a Freedom of Information request that a whopping 10,320 knife crimes have been recorded since November 2020.
This works out as around 9 knife crimes happening every day in Avon & Somerset Policing areas.
Towns with the highest rates of knife crime according to A&S police.
- Bristol 47%
- Somerset 25%
- South Gloucestershire 11%
- North Somerset 9%
- Bath and North East Somerset 7%
Cambridgeshire
Knife Crime in Cambridgeshire skyrocketed during the height of the pandemic.
The number of recorded incidents in the county rose a staggering 8 times from the year before.
Figures obtained via a Freedom of Information request show that 168 knife crimes were recorded by Cambridgeshire Police in 2020, this rose to a staggering 1,353 in 2021.
In 2022, a total of 1,218 incidents are confirmed, which then declined to 699 last year, 2023.
Peterborough accounted for 40% of all knife crimes since November 2020, according to police. While 22% of incidents happened in Cambridge City.
Breakdown of areas with the highest rates of knife crime according to Cambridgeshire Constabulary.
- Peterborough 40%
- Cambridge City 22%
- Huntingdon 13%
- Fenland 10%
- South Cambridgeshire 9%
Cheshire
A total of 1,590 knife crimes were recorded by Cheshire Constabulary since November, 2020.
Of all incidents recorded since 2020, Warrington accounted for 24% of knife crimes in Cheshire. Surprisingly, the city of Chester came bottom of the list for the highest rates of knife crime in the county.
Breakdown of areas with the highest rates of knife crime according to Cheshire Constabulary.
- Warrington 24%
- Crewe 12%
- Macclesfield 11%
- Widnes 10%
- Chester 10%
Hertfordshire
The number of knife crimes in the county rose 5 times from the year before.
Nearly 2,000 knife crimes were recorded by Hertfordshire Police since November 2020.
A total of 159 incidents were reported in 2020, this increased to 756 in 2021.
In 2022, figures slightly decreased to 595, further lessening in 2023 with 456 knife crimes recorded.
Watford saw the most knife crimes during this period, accounting for 14% of the county’s incidents. Welwyn Hatfield saw 13% of knife crimes in Hertfordshire since November 2020.
Breakdown of areas with the highest rates of knife crime according to Hertfordshire Constabulary.
- Watford 14%
- Welwyn Hatfield 13%
- Dacorum 11%
- Stevenage 11%
- Broxbourne 10%
Humberside
Kingston Upon Hull is the worst area for knife crime in Humberside.
Nearly 3,000 knife crimes were recorded by Humberside Police between November 2020 and September 2023.
41% of all incidents in the county happened in Kingston Upon Hull with a total of 1,213.
Breakdown of areas with the highest rates of knife crime according to Humberside Police.
- Kingston Upon Hull 41%
- North Lincolnshire 23%
- North East Lincolnshire 23%
- East Riding of Yorkshire 13%
Northumbria
Northumbria has an average of three knife crimes every day.
A total of 3,546 knife crimes were recorded by Northumbria Police between November 2020 and September 2023.
45% of all incidents in the county happened in Central Northumbria with a total of 1,601
Breakdown of areas with the highest rates of knife crime according to Northumbria Police.
- Central 45%
- Southern 30%
- Northern 24%
West Mercia
West Mercia has an average of nine knife crimes every day,.
New figures show that a total of 9,912 knife crimes were recorded by West Mercia Police between November 2020 and September 2023.
The majority of incidents happened in South Worcestershire, accounting for 24% of overall figures with a total of 2,390 knife crimes in that period.
Breakdown of areas with the highest rates of knife crime according to West Mercia Police.
- South Worcestershire 24%
- North Worcestershire 23%
- Telford & Wrekin 21%
- Shropshire 20%
- Herefordshire 12%
If you’re looking for advice on making a claim through the CICA for a knife crime injury or another type of criminal injury, you can contact Personal Injury Claims UK for free today.